The Excel spreadsheet of test results can be analysed in two ways:
Reading the horizontal rows provides student-level information. This data can be used to identify students who need intervention and extension. It can also be used to form groups of students working at a similar level for both intervention and tier one class teaching.
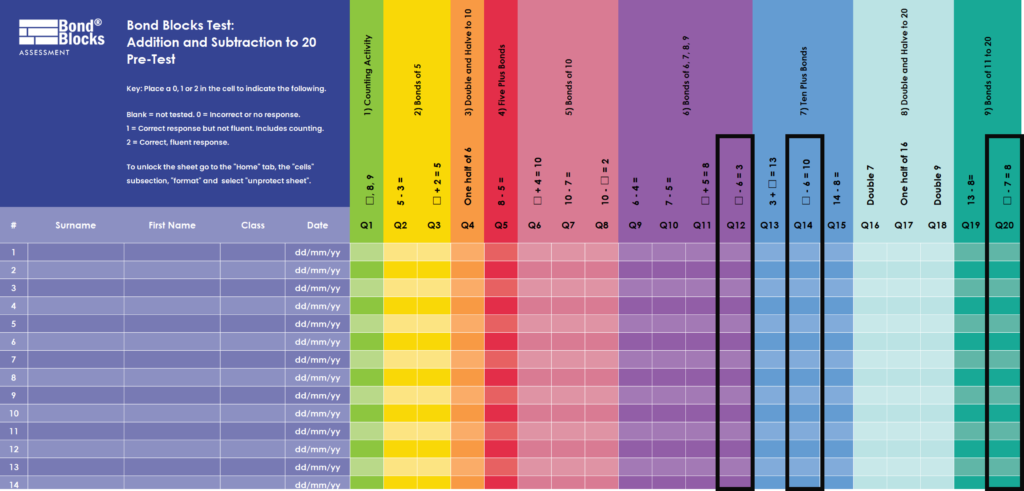
Reading the vertical columns provides cohort-level information. Columns where most of the students have had difficulty show gaps in teaching/learning. This is frequently in the content areas of missing number equations and word questions. Once these content areas are identified use the “Mathematical Concepts Covered by Each Bond Block Activity” located under the Implementation section and find activity numbers related to those topics. Complete these activities with the cohort.
For example, each of the questions highlighted above have the whole as the missing number in subtraction. The Mathematical Concepts Covered table linked above shows these questions relate to Activities 13, 32, 39, 48, 49 and 67. Use the data in this way to inform targeted teaching at either a whole class or intervention level.
Progress Points
Student responses to each test item are recorded in the Excel spreadsheet using:
0 = Incorrect or no response.
1 = Correct response but not fluent. Includes counting.
2 = Correct, fluent response.
These scores can be added to create a total for each test. Then totals between annual tests can be compared.
This is data collected from Year One students in Western Australia. The students used the Bond Blocks Core Kit as tier 2 intervention only.
The data shows:
Four students (green) made excellent progress.
One student (yellow) made less progress in comparison, but this was still pleasing. This student had a diagnosis that accounted for this.
Two students (pink) made very little progress. The class and intervention teachers had a range of concerns about these Year One students. This data added to evidence that was presented to the principal and parents which led to investigation by medical and allied health professionals.